TLDR
- ADA is currently trading near $0.27, moving toward a significant descending trendline around $0.28 that has consistently served as resistance
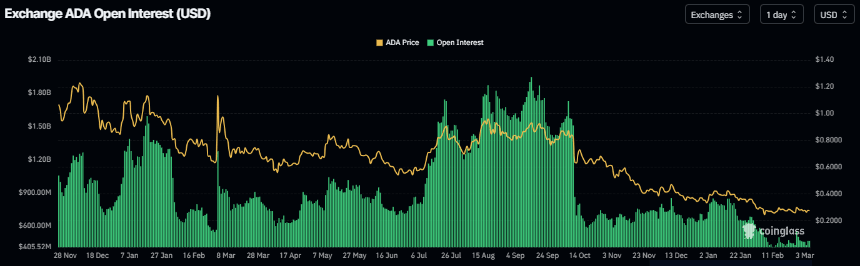
- Open interest has fallen to $462 million and the long-to-short ratio is at 0.79, both indicating bearish market sentiment
- ADA continues to trade substantially beneath its 50- and 100-day EMAs, which are grouped above the $0.30 level
- The RSI is at 46, under the neutral 50 mark, indicating feeble momentum recovery
- The manufacturing PMI has climbed to 52.4%, marking its third straight monthly rise in 40 months, a development that has historically preceded ADA price increases
On Thursday, March 6, Cardano (ADA) is trading at $0.27 as the price nears a crucial descending trendline around $0.28. This trendline recently rejected the price once and remains the primary near-term obstacle.

Derivatives data supports the bearish outlook. Cardano’s futures open interest has declined to $462 million and has been decreasing consistently since mid-January.
When open interest declines while prices remain stable or fall, it typically indicates that traders are retreating from the market.
The long-to-short ratio on CoinGlass is currently 0.79. This reading is close to its lowest point in more than a month, demonstrating that more traders are betting on price drops than increases.
ADA is also trading significantly under its 50-day and 100-day Exponential Moving Averages, which are both positioned above $0.30. This disparity underscores the prevailing broader bearish trend.
The RSI on the daily chart is at 46. Although it has bounced back from oversold levels, it stays beneath the 50 midpoint, suggesting that momentum remains fragile.
The MACD indicator is in modestly positive territory, but the histogram is flat. This indicates consolidation rather than a definitive trend reversal.
Key Price Levels to Watch
On the upside, the first resistance level is the trendline near $0.28. A more substantial barrier exists at $0.32, where the descending EMAs also meet.
A daily close above $0.32 would be required to break the existing bearish structure.
Support is located at $0.26, with a horizontal floor at $0.24 below it. If ADA drops below $0.24, it could lead to additional declines.
For the time being, ADA appears likely to remain within a $0.26 to $0.29 range unless a catalyst drives it above resistance.
Macro Indicator Points to Possible Shift
Bitcoin recently jumped above $73,000 to reach a one-month high, but ADA did not follow suit. It recorded only a slight increase and failed to close higher than the previous day’s candle.
Altcoins have been through one of the longest periods of economic suppression in decades.
Crypto survived all of this.
QT, macro tightening, economic slowdown, and altcoins are still here.
So the question is simple:
What happens if the economy actually starts expanding again?…
— Dan Gambardello (@dangambardello)
Market analyst Dan Gambardello has identified the manufacturing Purchasing Managers Index (PMI) as a crucial data point for the longer-term outlook.
The PMI, which measures the health of the manufacturing sector, is currently at 52.4%. This represents the third straight monthly increase in 40 months.
Gambardello observes that previous periods of PMI expansion have historically coincided with bullish phases for ADA.
The present configuration also mirrors the 2019 correction, during which ADA recorded red candles in six out of seven months before staging a strong recovery.
Quantitative tightening concluded in December 2025. According to Gambardello, this development, together with a rising PMI, reflects the macroeconomic environment that preceded Cardano’s last significant price expansion.
ADA is presently experiencing its sixth consecutive monthly red candle after a bearish February close.

