TLDR
- DOGE’s RSI has reached a deeply oversold state, indicating seller exhaustion.
- A 4-hour wedge breakout has formed a bullish cup-and-handle pattern.
- A MACD crossover supports a short-term shift in momentum.
- The weekly 0.786 Fibonacci level near $0.08 marks a crucial demand zone.
The price of Dogecoin (DOGE) is nearing a technically critical zone as several indicators suggest its downward momentum could be waning. Analysts observing RSI trends, intraday chart patterns, and weekly Fibonacci support levels have noted a convergence around the $0.08 to $0.10 range. This collection of signals is fostering expectations for a period of stabilization following a prolonged correction.
Dogecoin Price Reaches RSI Extreme on Daily Chart
Analyst Trader Tardigrade notes that the daily chart structure shows momentum cycles moving in close alignment with RSI highs and lows. Previous price peaks coincided with the RSI entering overbought conditions, signaling buyer exhaustion. The following price drop confirmed the oscillator’s role as an early indicator of distribution.
Furthermore, the downward move occurred without any bullish divergence. The RSI consistently formed lower highs as the price trended lower in an orderly manner. This pattern suggested a complete sentiment reset rather than a brief pullback, with sellers retaining control for the duration of the decline.

The indicator is now in deeply oversold territory. Historically, similar readings have signaled the final stages of selling pressure for Dogecoin. While not a certain reversal signal, such extremes often lead to consolidation or corrective rallies. Consequently, momentum appears overextended after months of declines.
Cup-and-Handle Pattern Forms Following Wedge Breakout
On the 4-hour chart, the technical outlook appears more positive. Tardigrade pointed out that DOGE recently broke out from a descending broadening wedge. This pattern typically resolves to the upside as volatility contracts and selling pressure diminishes.
After the breakout, Dogecoin’s price action formed a rounded base that developed into a recognizable cup pattern. A subsequent handle formed through a period of tight consolidation with minimal pullback. Such formations usually represent pauses in a continuation move rather than the start of new selling.
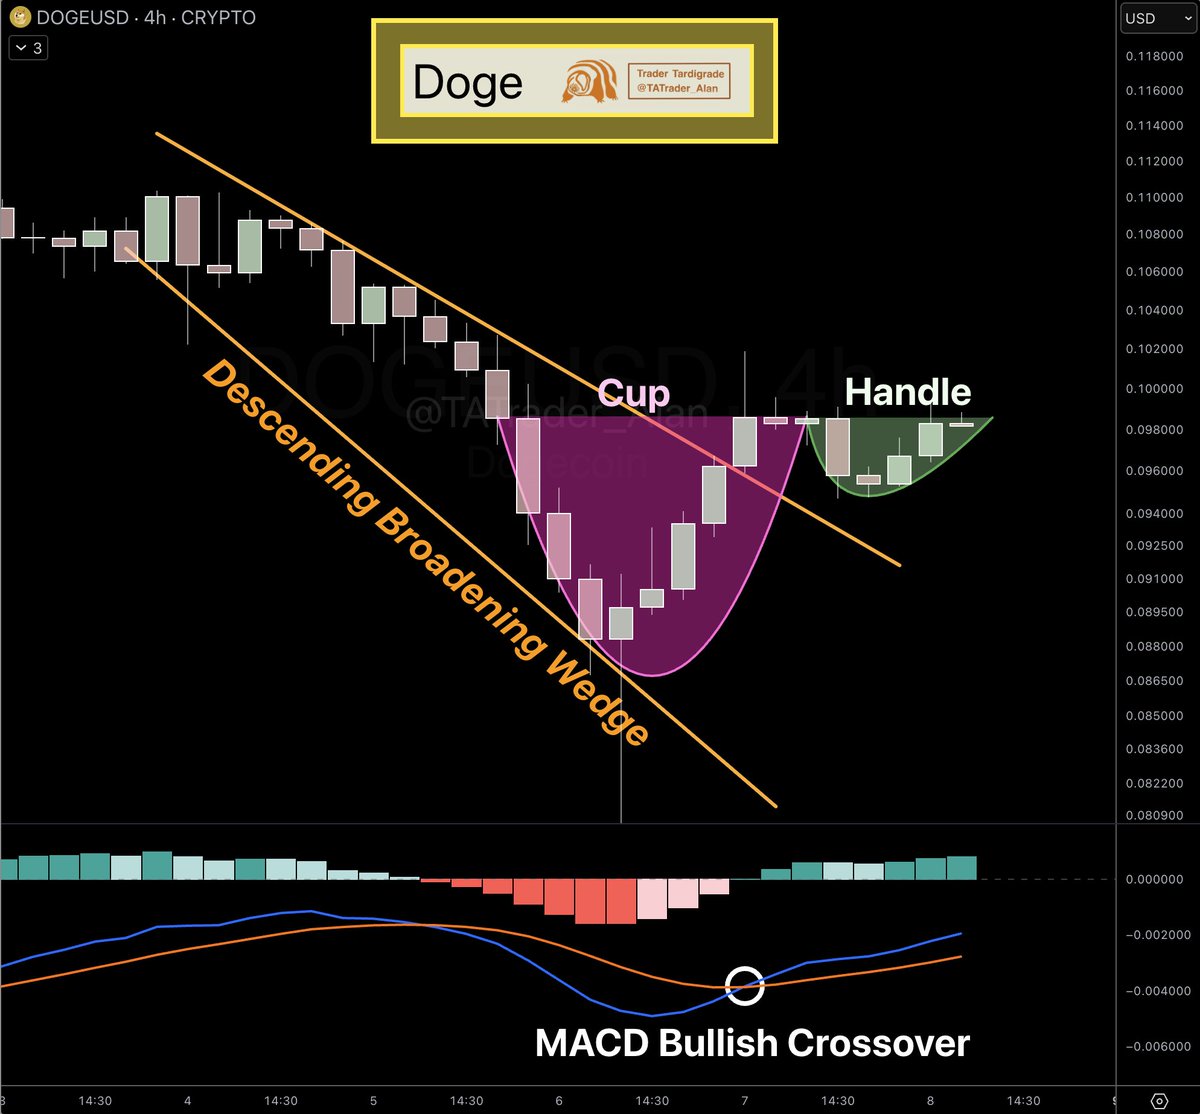
Momentum indicators are also starting to corroborate this shift. The MACD has produced a bullish crossover, and its histogram bars have turned positive. When strengthening momentum coincides with a cup-and-handle pattern, traders frequently anticipate a price expansion. A breakout above the handle’s resistance could draw more market participation.
Weekly Fibonacci Zone Provides Structural Anchor
Adding to the analysis, higher-timeframe examination from analyst Surf underscores the significance of the 0.786 Fibonacci retracement level near $0.08. This level, drawn from the prior major upward move, often serves as a final support area during corrections. Long-term investors commonly watch these zones for signs of accumulation.
The current price is trading within a wider demand band between $0.08 and $0.10. The region’s credibility is reinforced by historical price reactions and clustered trading volume. Its repeated importance in past market cycles highlights its key role. How the price behaves within this band will be critical.
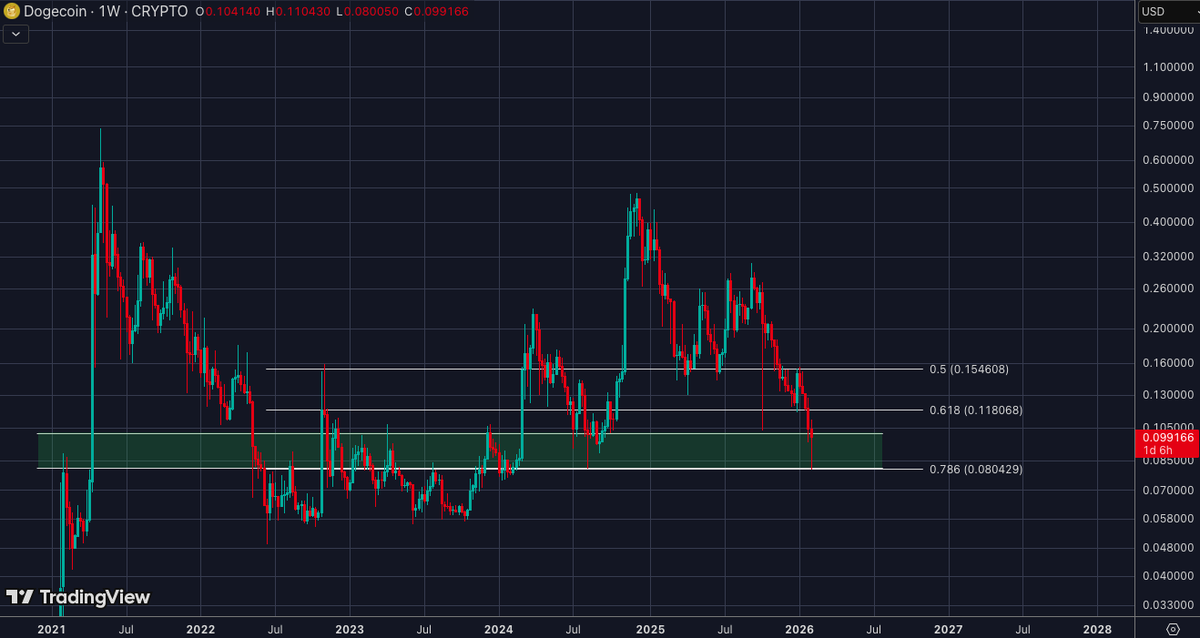
Surf notes that consolidation within this range hints that accumulation may be underway. Downward momentum has eased as the price consolidates near support. If weekly closing prices continue to hold above this retracement level, the broader market structure would stay intact. This higher-timeframe context aligns with the improving signals observed on shorter timeframes.
