TLDR
- ETH maintains critical $2,000 demand zone amid ongoing daily downtrend.
- A descending trendline keeps short-term market bias cautious.
- The $1,980–$2,120 range limits price momentum.
- Weekly macro trendline underpins the broader uptrend.
Ethereum (ETH) is trading near a critical technical zone as multiple timeframes converge around long-term support levels. Analysts identify the $2,000 region as a decisive level—if it fails, downside risk could extend to $1,500. Meanwhile, higher-timeframe structures suggest consolidation rather than a structural collapse.
Ethereum Price Encounters Daily Pressure Below Key Resistance
According to analyst CryptoWZRD, Ethereum’s price remains trapped in a corrective pattern on the daily timeframe. A clearly defined descending trendline continues to cap upward attempts, reinforcing a pattern of lower highs and lower lows. This dynamic resistance confirms sellers still control the broader price direction.
From a horizontal perspective, Ethereum has lost several major support zones. The $3,700 and $2,800 levels have flipped to resistance, weakening bullish positioning. The recent sell-off pushed the price into the $2,100–$2,000 demand zone, which has historically attracted buyers.
ETH Daily Technical Outlook: closed indecisively. However, its intraday chart is positive and I expect to see further upside unless Bitcoin declines from a fundamental reason. Bitcoin will also help in that. Once our current position is secured, I’ll look for more trades

— CRYPTOWZRD (@cryptoWZRD_)
Long lower wicks signal reactive buying interest at this level. However, conviction remains limited without a trendline break. Holding $2,000 could enable a relief bounce toward $2,400–$2,600, while a failure would expose downside risk to $1,500.
Range-Bound Trading Dominates Short-Term ETH Conditions
Meanwhile, analyst Jip Molenaar highlighted a range on the intraday chart. Ethereum’s price oscillates around $2,050, which acts as a short-term equilibrium level. Price behavior reflects rotation between liquidity zones rather than directional momentum.
The analysis points to potential liquidity sweeps on both sides of the range. Upside moves toward $2,120 may target stop-losses before reversing, while downside probes to $1,980–$2,000 could serve as liquidity grabs below equal lows.

Until the price breaks outside this range, conditions remain reactive. False breakouts are likely without volume expansion. A sustained move above $2,120 would shift short-term bias toward $2,200, while acceptance below $1,980 would reopen the path to higher-timeframe demand.
Weekly Chart Shows Ethereum Price Holding Macro Trend
Additionally, TrendSpider’s weekly logarithmic chart presents a broader structural view. Ethereum’s price continues to respect an upward trendline that has guided it since the 2022 cycle low. Recent reactions at this support suggest long-term buyers remain active.
Moreover, the structure resembles a large consolidation phase within an established macro uptrend. Price oscillates between ascending support and resistance near the $4,400–$4,500 zone. Volume profile data shows strong acceptance between $2,000 and $2,200, defining a high-value zone.
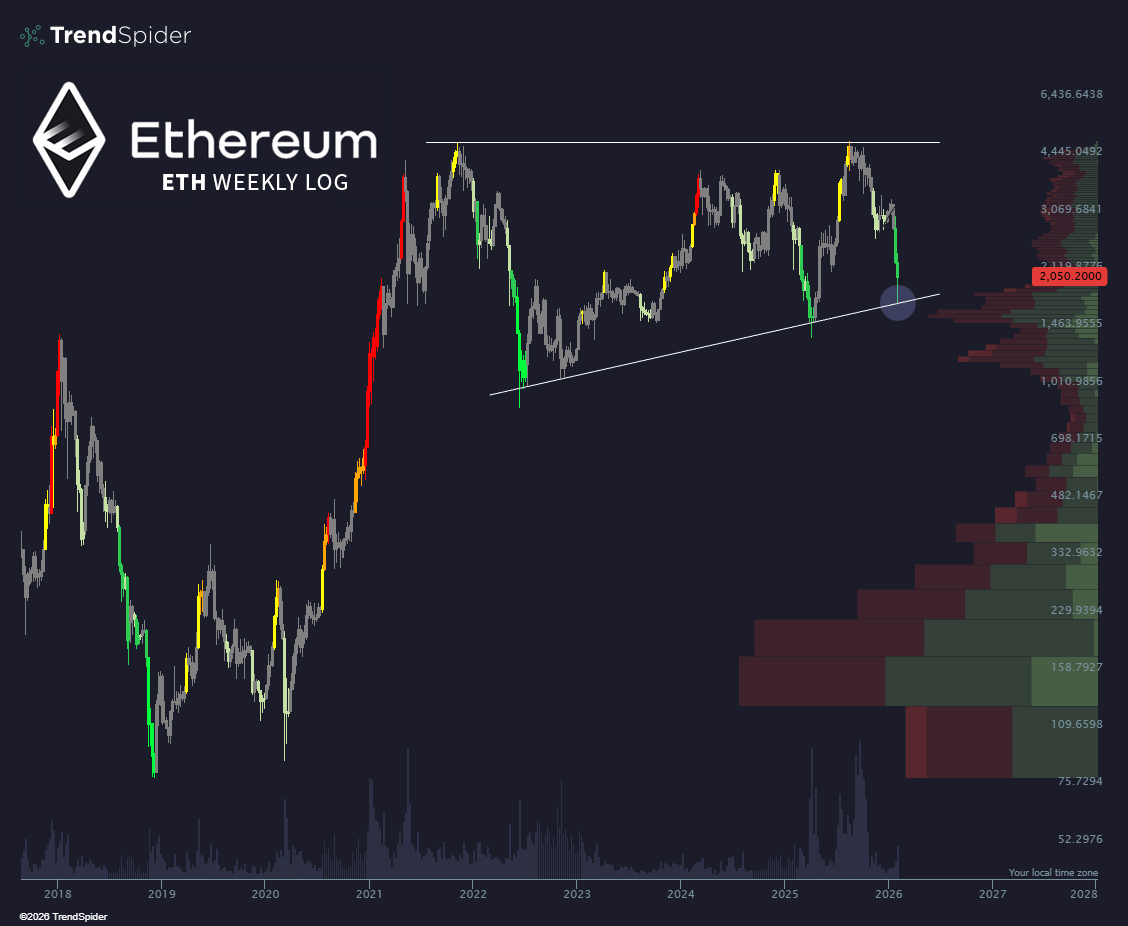
As long as the upward trendline holds on a weekly closing basis, the broader structure remains intact. A breakdown would significantly weaken the bullish framework and expose deeper retracement risk. For now, the chart supports consolidation rather than trend failure.

