TLDR
- Solana fell to $95.87 during a recent market downturn, testing the significant $100 support level as Bitcoin declined towards $75,000.
- Long liquidations reached $24.7 million out of a total of $35.3 million within a 24-hour period, and funding rates turned negative at -0.0057%.
- Solana spot ETFs experienced their first weekly outflows of $2.45 million since their inception, indicating a decrease in institutional interest.
- The Chaikin Money Flow indicator shows a bullish divergence near the $96 support level, suggesting that substantial buyers are entering the market despite a 15.5% weekly price drop.
- For SOL to signal a shift in momentum, it needs to close above $120.88 on a daily basis, with potential price targets at $128 and $148.
The cryptocurrency market has entered a state of extreme fear, with the Crypto Fear & Greed Index dropping to 14. The total market capitalization has fallen to $2.54 trillion, representing a loss of over $500 billion in recent days.

Solana experienced significant selling pressure during this market decline. The cryptocurrency tested the $100 psychological support level as Bitcoin’s price dropped towards $75,000.
SOL reached a low of $95.87 before finding support. The price has since rebounded to approximately $103-$105, showing a gain of about 3-8% from its lowest point.
Liquidation data from Coinglass highlights the intensity of the selling. Solana faced total liquidations amounting to $35.3 million over a 24-hour period, with long positions accounting for $24.7 million of this total.

The funding rate for Solana futures has turned negative, recorded at -0.0057%. This indicates that a greater number of traders are anticipating further price decreases. Currently, short sellers are compensating long traders, which is considered a bearish indicator.
The ratio of long to short positions stands at 0.94. A ratio below 1 suggests that more traders expect prices to decline rather than increase.
Institutional Money Shows Signs of Retreat
There are indications that institutional interest is waning. According to SoSoValue, Solana spot ETFs recorded net outflows totaling $2.45 million last week. These outflows mark the first weekly withdrawals since the ETFs were launched.
A continuation of these outflows could exert downward pressure on the price in the short term. However, on-chain data presents a more nuanced situation.
The Chaikin Money Flow (CMF) indicator is displaying a bullish divergence. While SOL’s price decreased from late January to early February, the CMF moved upward. This suggests that significant buyers have been accumulating positions around the $95-$96 price range.
CMF analyzes capital flows based on price and trading volume. An increasing CMF during a price decline suggests that large investors, often referred to as whales or institutions, perceive current price levels as attractive.
Long-Term Holders Remain Patient
Liveliness data indicates that long-term holders have not engaged in panic selling. Liveliness measures the frequency with which long-held coins are transacted. An increase in liveliness suggests that long-term holders are selling, while a decrease indicates they are holding onto their assets.
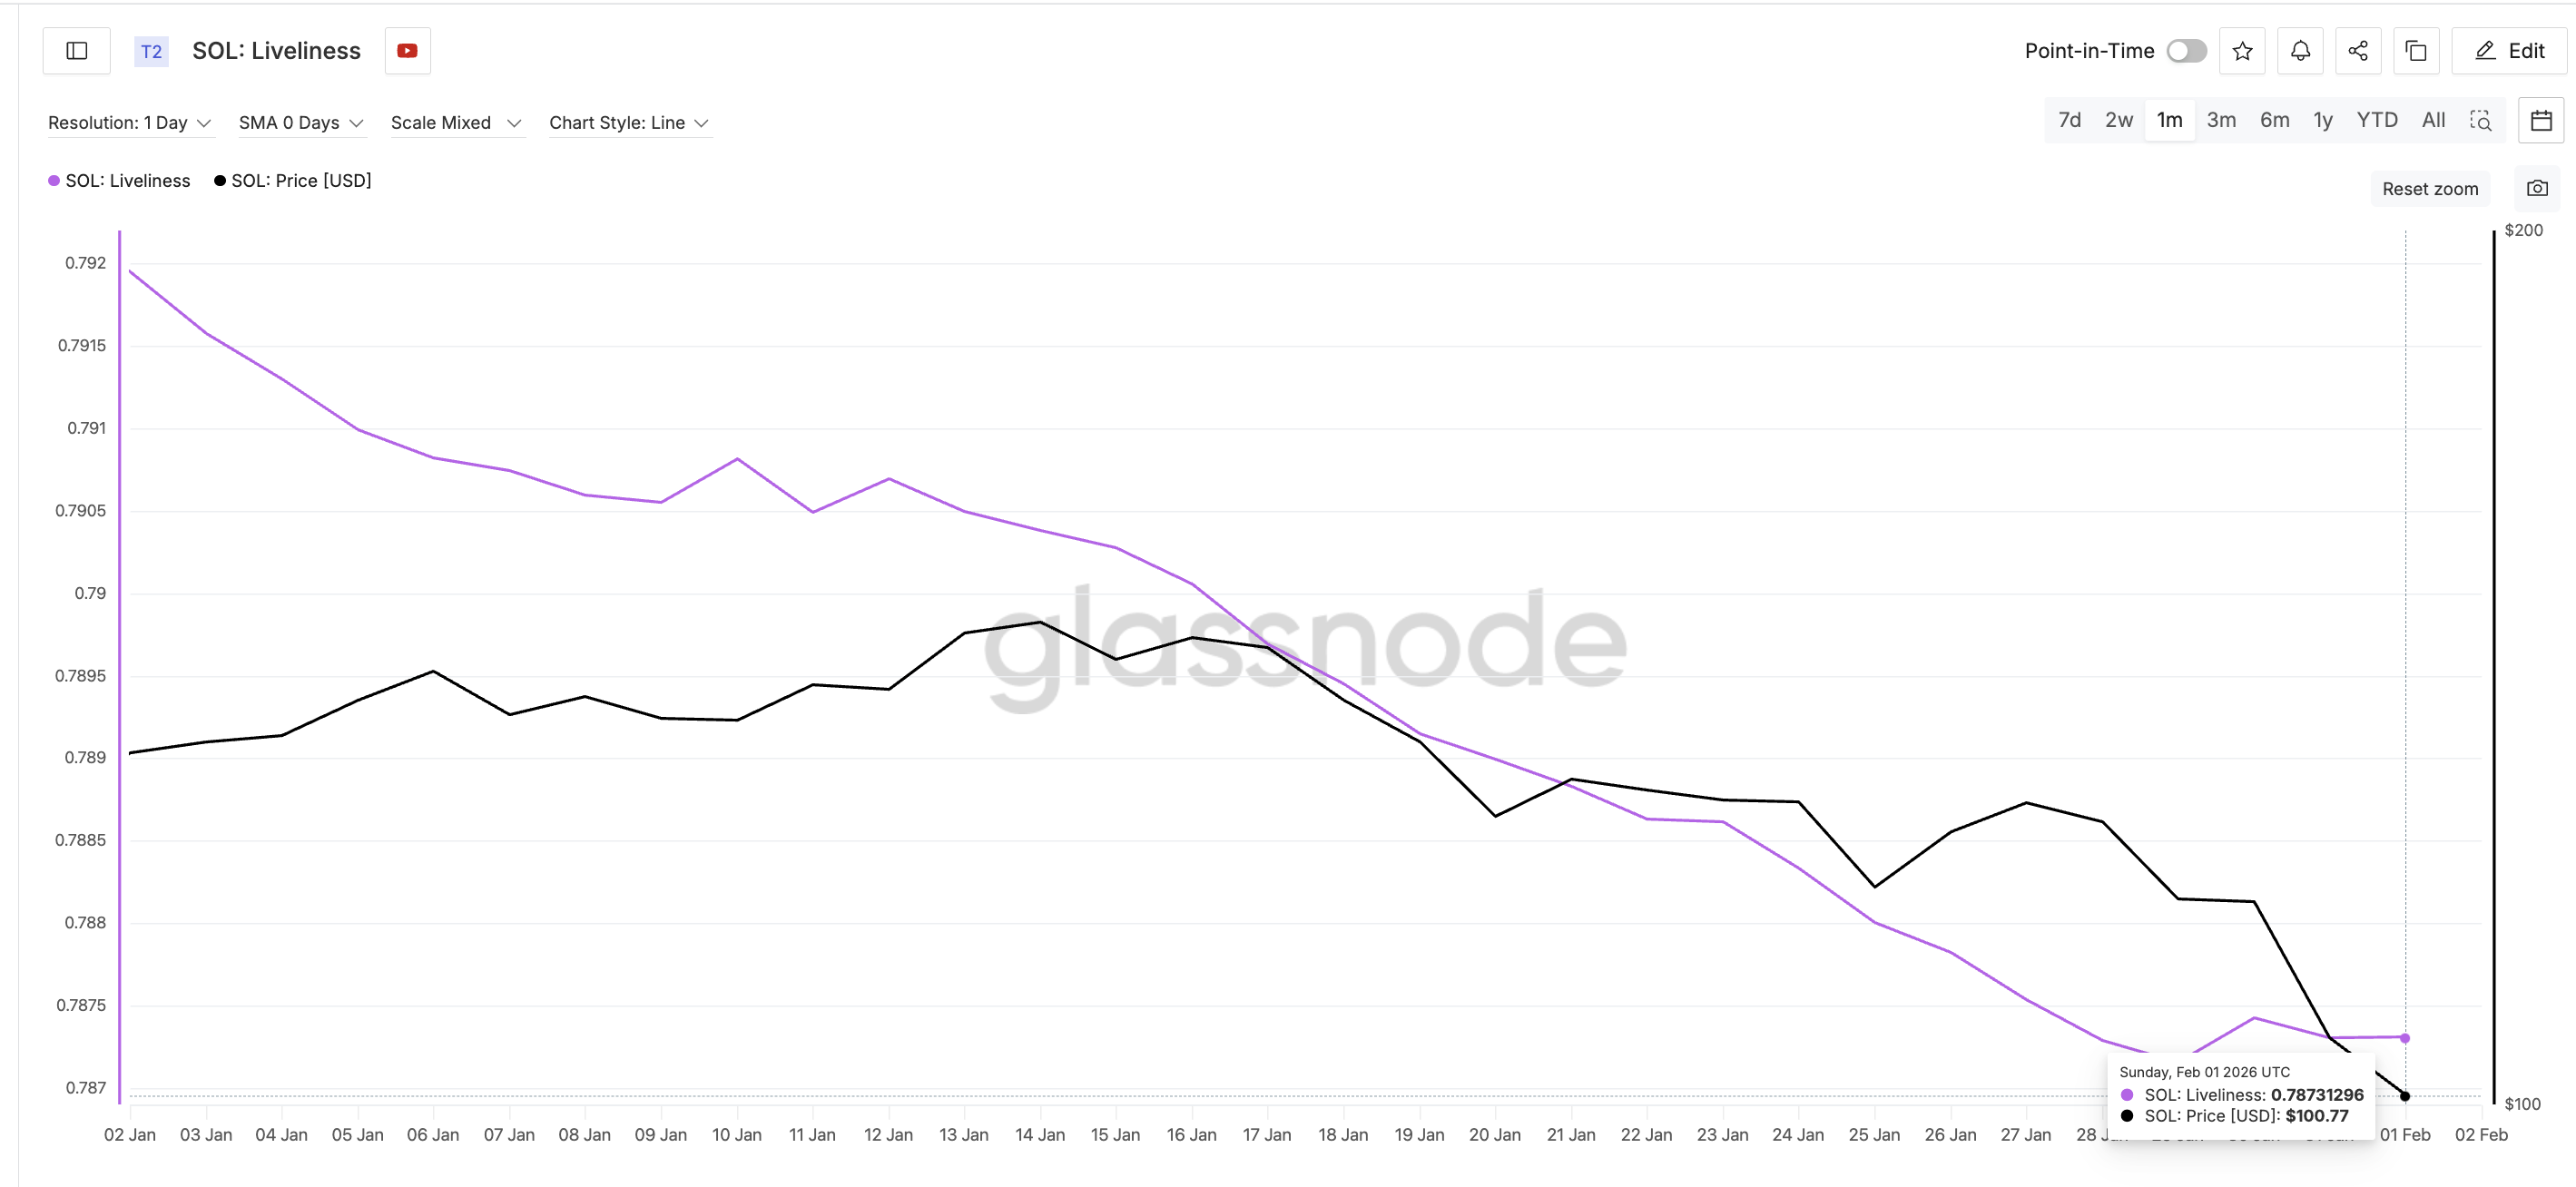
Solana’s liveliness metric has shown a downward trend over the past month. Even during the sharp price drop from $127 to below $100, liveliness remained subdued. This suggests that long-term investors view the current price decrease as temporary.
Conversely, short-term activity has increased. The proportion of holders within the 1-day to 1-week cohort grew from 4.38% to 5.26% between December 31 and February 1. This increase in short-term traders can contribute to price volatility and potentially limit the extent of any rallies.
SOL broke below a trading range between $117 and $147 in late January. This breakdown followed a head-and-shoulders chart pattern, which projected a target price near $95-$96. This target was nearly met, with the price reaching $95.87.
Critical Price Levels to Watch
The $95-$96 area now represents crucial support. As long as SOL maintains its price above this level, the current rebound structure is likely to remain intact. A breach below $95 could lead to further declines, potentially towards $80 or even $77.
last seen $100 in January 2024.
If the market behaves well, this could be a smart entry.
Opportunities like this don’t show up often.
— Lucky (@LLuciano_BTC)
On the upside, $103.60 is the immediate resistance level. SOL is currently testing this price point.
The most significant resistance level is at $120.88. This price point marked a breakdown on January 29 and also aligns with the 20-day exponential moving average.
A daily close above $120.88 would indicate that buyers are regaining control of the market and suggest that the correction phase may be concluding. Above $120, the next potential price targets are $128.29 and $148.63.
The cryptocurrency’s recovery hinges on sustained capital inflows and consistent behavior from long-term holders. If the CMF crosses above zero, it would confirm that buying pressure is overcoming selling pressure. However, the influence of short-term traders could impede rallies before higher price targets are reached.
SOL is currently trading between $103 and $105, having recovered from the $95.87 low as buyers defend the $100 psychological support level.

