TLDR
- ETH is trading between roughly $2,216 and $2,234, marking a roughly 6% gain following the US-Iran ceasefire announcement
- Ethereum’s open interest rose by $2.2 billion, with buyers dominating futures market activity
- Ethereum’s total transfer count exceeded 1.3 million transactions, a new all-time high
- ETH’s staking ratio has passed 30% for the first time ever, with $84.8 billion worth of tokens staked
- The Coinbase Premium Index has turned positive, signaling increased US-based demand for ETH
(SeaPRwire) – Ethereum has seen a strong week of improved on-chain data, even as its price remains well below its all-time high. Several key metrics have reached record levels, driven in part by a broader easing of global tensions.

Ethereum climbed 6% in a 24-hour window after the US and Iran announced a ceasefire on Tuesday. This single-day gain marked ETH’s largest daily increase in over a month.
According to crypto analytics firm CryptoQuant, ETH’s USD-denominated open interest jumped by $2.2 billion following the ceasefire news. This brought open interest close to levels last seen nearly a month prior.
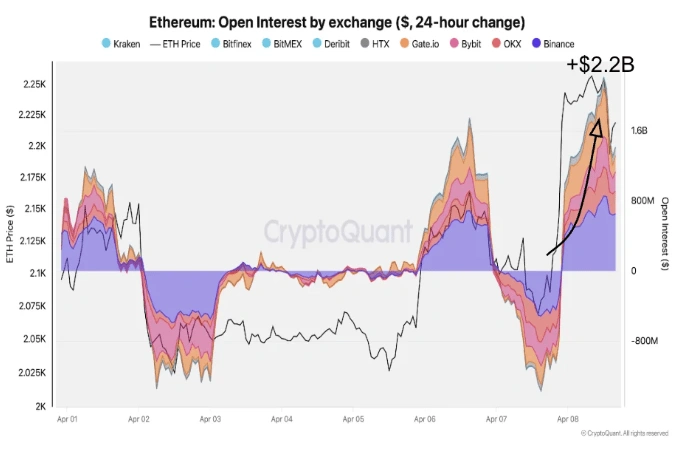
CryptoQuant analysts confirmed that coin-denominated open interest also rose. This rules out short liquidations as the primary driver and shows traders are opening new long positions.
Ethereum’s Taker Buy-Sell Ratio has also tilted upward, indicating that buyers are leading activity in ETH perpetual futures. A similar pattern was observed in Bitcoin futures, suggesting traders expect short-term macroeconomic improvement.
The ETH Coinbase Premium Index flipped positive this week. This signals growing demand from US-based buyers. CryptoQuant’s report noted that if the ceasefire holds over the next two weeks, the premium could remain positive and help support ETH prices.
Network Activity Hits New All-Time High
On April 10, CryptoQuant data showed that Ethereum’s seven-day simple moving average for total transfer count crossed 1.3 million transactions. This surpassed the previous peak recorded in mid-February.
Ethereum Network Activity Reaches New ATH: A Bullish Fundamental Divergence
“If this strong utility trend persists, the probability of the price eventually catching up with these robust on-chain fundamentals in the mid-term remains highly favorable.” – By @CryptoOnchain pic.twitter.com/doE1Lrg0RL
— CryptoQuant.com (@cryptoquant_com) April 10, 2026
The surge in transfer activity reflects growing usage across decentralized finance, layer-2 networks, ETF markets, and smart contract applications.
Analyst Daan Crypto Trades posted on X this week: “$ETH is consolidating around the $2.1K key long-term resistance level from the past few years. The $2.1K–$2.8K range is one to watch if the weekly candle closes in this area. Markets have been incredibly choppy over the past few weeks, and bulls will want to push above the local high around $2.4K to kickstart a rally.” His comment highlights the key price zones traders are monitoring.
$ETH Consolidating around the $2.1K big high timeframe level from the past few years.
$2.1K-$2.8K is the range to watch if the weekly can close in this area.
The past few weeks have been incredibly choppy and the bulls would want to push above that local high around $2.4K to… pic.twitter.com/udI2hOHoCy
— Daan Crypto Trades (@DaanCrypto) April 10, 2026
Staking Ratio Crosses 30% for the First Time
Ethereum’s staking ratio has crossed 30%, reaching a new all-time high, according to Token Terminal data from April 9. The total staked market capitalization currently stands at $84.8 billion.
Ethereum remains the top staking blockchain by a wide margin. Solana follows in second place with $36.2 billion staked, while BNB Chain ranks third at $15.5 billion.
A higher staking ratio means fewer ETH tokens remain available as liquid supply on the open market. This reduction in liquid circulating supply can impact price dynamics over time.
ETH saw $54.4 million in total liquidations over the past 24 hours, with $34.5 million coming from short positions, per data from Coinglass.
On its price chart, ETH is holding above its 20-day EMA at $2,128 and 50-day EMA at $2,156. A key resistance level sits at $2,388, where the 100-day EMA and a horizontal price barrier converge.
Ethereum ETF Flow (US$ million) – 2026-04-10
TOTAL NET FLOW: 64.9
ETHA: 53.7
ETHB: 8.1
FETH: -0.6
ETHW: 0
TETH: 3.7
ETHV: 0
QETH: 0
EZET: 0
ETHE: 0
ETH: 0For all the data & disclaimers visit:https://t.co/FppgUwAthD
— Farside Investors (@FarsideUK) April 11, 2026
Farside Investors reported on April 10 that US-listed Ethereum ETFs recorded a total net inflow of $64.9 million for that trading day.
This article is provided by a third-party content provider. SeaPRwire (https://www.seaprwire.com/) makes no warranties or representations regarding its content.
Category: Top News, Daily News
SeaPRwire provides global press release distribution services for companies and organizations, covering more than 6,500 media outlets, 86,000 editors and journalists, and over 3.5 million end-user desktop and mobile apps. SeaPRwire supports multilingual press release distribution in English, Japanese, German, Korean, French, Russian, Indonesian, Malay, Vietnamese, Chinese, and more.

