TLDR
- Solana’s price is holding just above $80 after experiencing a more than 4% decline on Tuesday, struggling to recover from recent losses.
- The stablecoin supply on the Solana network increased by 14% over the past week, reaching $15.34 billion, suggesting that users are keeping capital on-chain despite a cautious market sentiment.
- SOL futures Open Interest saw a 2.74% decrease, settling at $5.08 billion, with long liquidations amounting to $6.09 million, significantly higher than the $2.01 million in short liquidations.
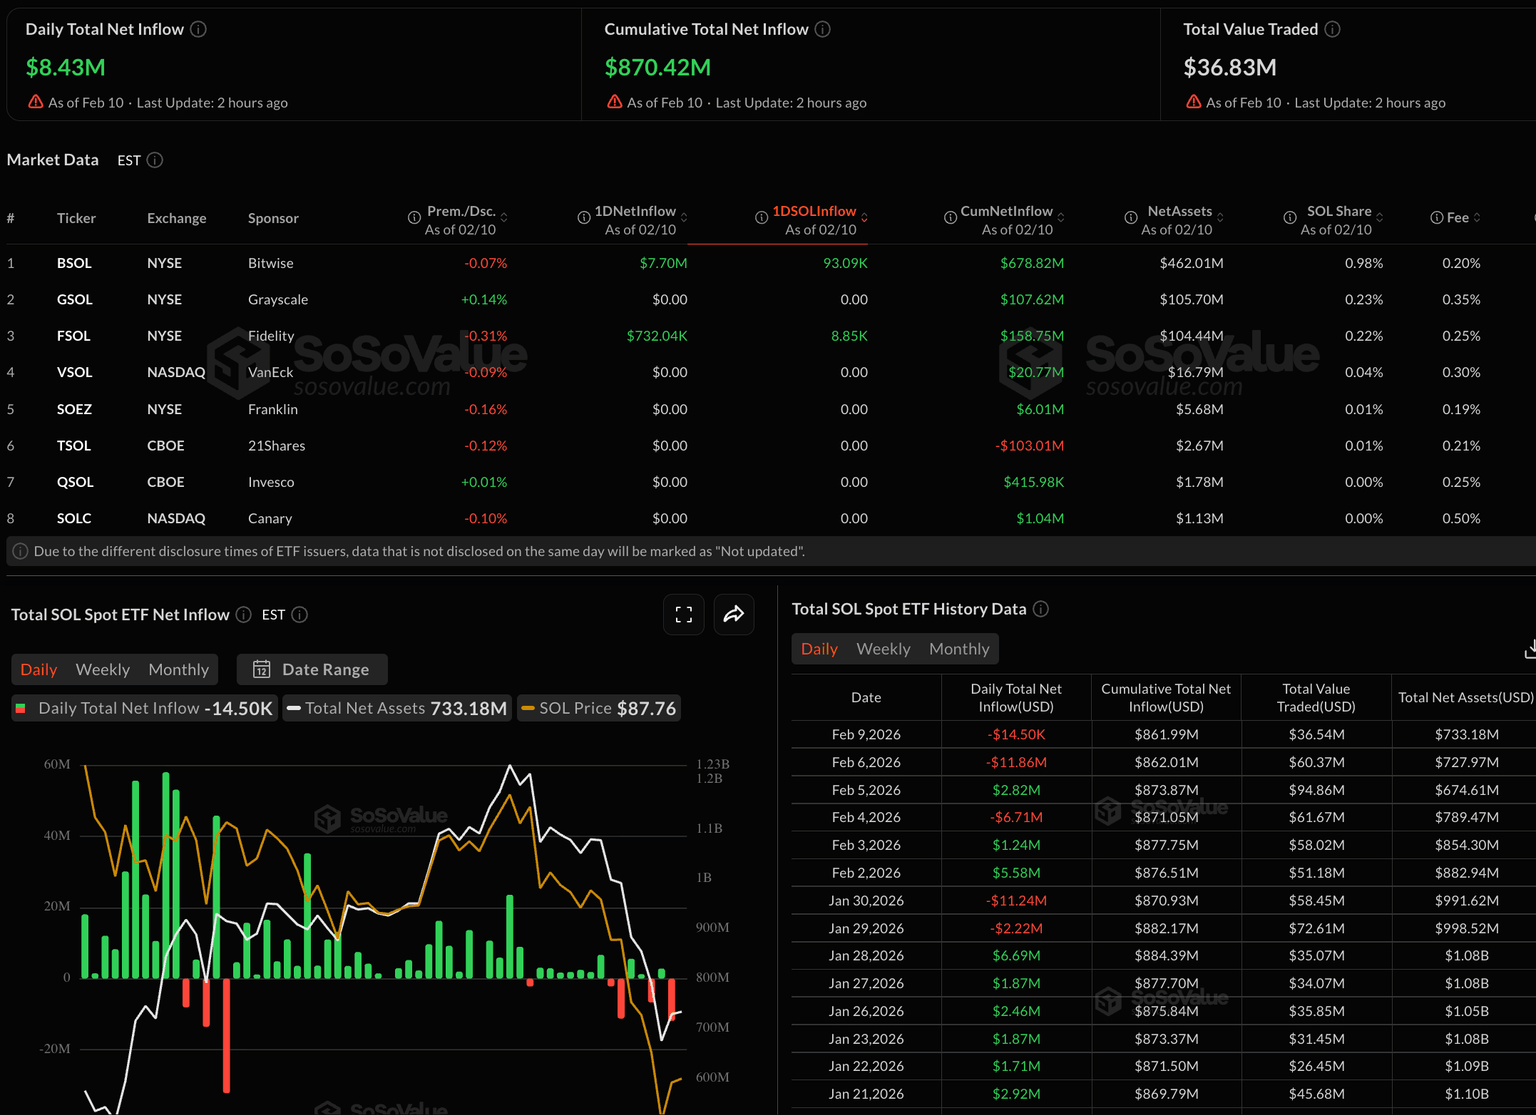
- US spot SOL Exchange Traded Funds (ETFs) recorded $8.43 million in inflows on Tuesday, indicating ongoing institutional demand at reduced price points.
- Technical analysis shows Solana trading below key moving averages of $116 and $148, with immediate support identified at $80 and resistance at $85.
Solana is trading at $82 on Wednesday, following a loss of over 4% on Tuesday. The layer-1 blockchain is currently under pressure as it attempts to maintain its position above the $80 support level.

The token’s value fell below $85 and is now trading beneath its 100-hour simple moving average. A significant bearish trend line has emerged on the hourly chart, establishing resistance at $85.
Despite the current price weakness, on-chain data presents a mixed picture for Solana’s market structure. The stablecoin supply on the network saw an approximate 14% increase over the past week.
Are traders still showing extreme fear after Bitcoin recovered from its $60.0K drop last week? According to social data, there is still a very high level of bearish posts compared to bullish.
With the crowd remaining pessimistic, the numbers suggest that retail is afraid…
— Santiment (@santimentfeed)
According to DeFiLlama data, the total stablecoin supply has reached $15.34 billion. This suggests that traders are converting volatile assets into stablecoins, yet choosing to retain their capital within the Solana blockchain.
Derivatives Data Indicates Bearish Sentiment
Data from the futures market indicates a decrease in trader interest. SOL futures Open Interest declined by 2.74% in the last 24 hours, reaching $5.08 billion.
During this period, long liquidations amounted to $6.09 million, while short liquidations were $2.01 million, highlighting a prevailing bearish sentiment among traders.
The funding rate, currently at -0.0061%, confirms heightened interest in short positions. This implies that traders are paying a premium to maintain bearish bets on Solana.
Institutional Investors Continue to Accumulate
On Tuesday, US spot SOL ETFs registered $8.43 million in inflows. This demonstrates sustained institutional demand despite the recent price downturn.
Consistent inflows at lower price points could potentially help Solana establish a price floor. If institutional buying persists, it may contribute to a trend reversal.
The Relative Strength Index (RSI) on the daily chart is at 27, signaling oversold conditions and hinting at a potential bounce back.
The Moving Average Convergence Divergence (MACD) shows a contraction in negative momentum, suggesting that bearish pressure might be diminishing according to this indicator.
Key Price Levels to Monitor
Solana is currently trading below its 50-day Exponential Moving Average (EMA) at $116. The 200-day EMA is positioned at $148, with both averages trending downwards, confirming a bearish market structure.
WHALE WATCH: levels are set.
=> Support 1: Healthy correction.
=> Support 2: Maximum pain / Maximum opportunity.
The bounce is inevitable. The only question is how much you’re willing to stack before the recovery begins.
Tick tock.
— Whale Factor (@WhaleFactor)
Immediate resistance is observed at $85, coinciding with the bearish trend line. Subsequent resistance levels are found at $92 and $96.
A successful breach above $96 could pave the way for a move towards $105 and $112. However, Solana must first overcome the $85 resistance to build upward momentum.
Support is established at $80, based on Fibonacci retracement levels. A drop below this point could push the price towards $75.
Should the $75 support fail, further declines could target $70. The 61.8% Fibonacci extension level at $64 represents a more significant support zone.
Earlier this week, Solana attempted a recovery, climbing above $78 and $82. The price managed to surpass the 50% Fibonacci retracement level but was unable to sustain its gains near $90.
